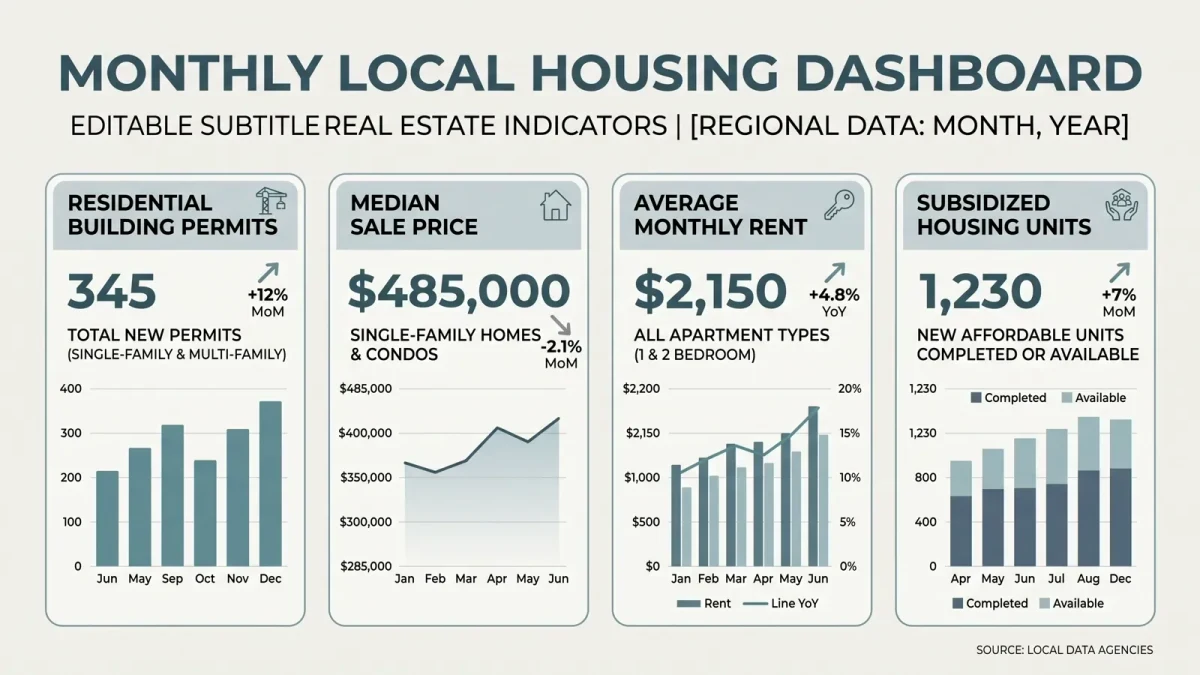
A local data story every month is available without a single records request: the federal statistical system publishes county- and city-level data on a known schedule, and the reporting work is comparison — this month against last month, this county against its neighbors. The U.S. Bureau of Labor Statistics releases local unemployment every month; the Census Bureau updates population, housing, and business measures on rolling schedules; and every release is public, free, and machine-readable.
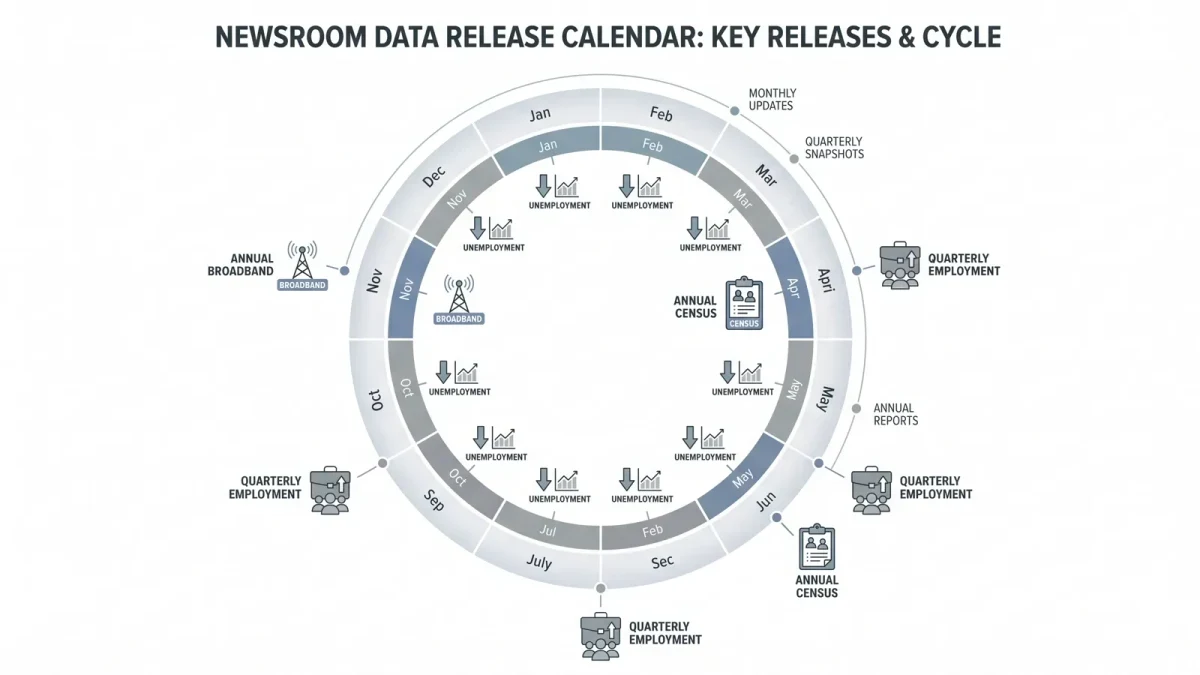
What does the monthly calendar look like?
| Cadence | Release | Local story it yields |
|---|---|---|
| Monthly | BLS local area unemployment | County joblessness vs. state and neighbors; youth and sector detail where published |
| Monthly | BLS consumer price index | What the national basket means for local rents and groceries |
| Quarterly | BLS employment by industry (QCEW) | Which local sectors are actually growing, by count and wage |
| Quarterly/annual | Census business formation | New employer businesses in the county — openings, closings, survivals |
| Annual | Census American Community Survey | Commute times, housing burden, language, age structure; change vs. prior year |
| Annual | FCC broadband deployment data | Which local addresses still lack adequate service |
How does a reporter turn a release into a local story?
The craft is anchoring the number to a named place and a person affected. A workable formula: the county figure, the comparison that gives it meaning — the state rate, the neighbor county, the same month last year — and one local voice explaining the mechanism. The American Statistical Association and the statistical agencies themselves publish reporting guides that stress the same warning: check the margin of error on small-area estimates before declaring a change, because many county-level moves are within the noise. Saying "essentially unchanged" when the data cannot distinguish is not weakness; it is the story being true.
What are the traps?
Three recur. Seasonality — comparing December retail employment to January without adjustment manufactures news out of the calendar. Revisions — BLS and Census figures are revised as more data arrive, so the durable practice is to link to the release and note the vintage rather than freeze numbers into posterity. And denominators — a raw count of new businesses in a large county will exceed a small county's every month; rates per resident are the honest comparison.
How does this become a habit rather than a chore?
Put the release calendar in the newsroom calendar, with a standing one-hour block the day each release lands. The story that results is modest but cumulative: after a year, the outlet owns the only running account of the local economy's actual shape, which is precisely the beat advertisers, funders, and readers cite when asked what local news is for. Several data-journalism trainers at universities recommend exactly this routine as the entry point for small newsrooms — start with scheduled public data, build the comparison habit, and save records requests for the questions the public data raises.
When does scheduled data justify a follow-up records request?
When the number is anomalous and the explanation is local: a sudden jump in a school district's per-pupil spending, a county unemployment spike concentrated in one industry. The public release tells you where to dig; the records request is how. That sequencing — scheduled data first, requests second — is the most efficient accountability workflow a small desk can run.
Frequently asked questions
Do these releases require any special software?
No. Every agency publishes tables and downloadable files; a spreadsheet is enough for comparisons. Chart tools help but the story is the comparison, not the graphic.
How local do the federal data actually get?
County level reliably, city and town level for many measures in the American Community Survey, with explicit margins of error. Below that, the honest answer is that estimates get thin — say so in the story.
Is it plagiarism of the agency's own write-up?
No, if you attribute — the figures are public data meant to be used. What fails standards is reprinting the agency's interpretive text as your own; the local meaning is the part the agency cannot write.